Increasing your visibility on social media is an effective way of building your brand, reaching potential new customers and nurture your sales funnel.
Creating engaging content that is related to your business or industry that people want to share is key to increasing the visibility of your posts. One great example of highly engaging and shareable content is an infographic.
An Infographic is a visual representation of information, typically in the form of a chart or diagram, however graphic designers are continuously find innovative and engaging way of sharing information via infographics.
Knowing how to use infographics in your business is an important part of an effective content strategy.
How To Use Infographics In Your Business
Infographics allow businesses to share information about their business or industry in an interesting way. They make great social media content as they are visual appealing and can illustrate complex situations is a simple and engaging way.
Some social media platforms only allow images, whilst others such as Twitter have character limits that make sharing large amounts of information in text form impractical. Words in an image do not contribute to character counts, making infographics an effective way of sharing complex information in a simple way.
The Concept Of Going Viral
Social media is a competitive place, so in order to stand out businesses must create engaging and shareable content.
Shareable content is the key to growing your social media network and influence. If you post something and it is shared by people you are connected with it is shared by people outside your network who may also share it with their network.
When this happens repeatedly over a short period of time you can reach thousands if not millions of people rapidly, a process that is often referred to as going viral.
Infographics have the potential to go viral, how to use infographics in your business to go viral is dependent on understanding your target market and the kind of information they find interesting and worth sharing.
30 Day Blogging Challenge Infographic Case Study
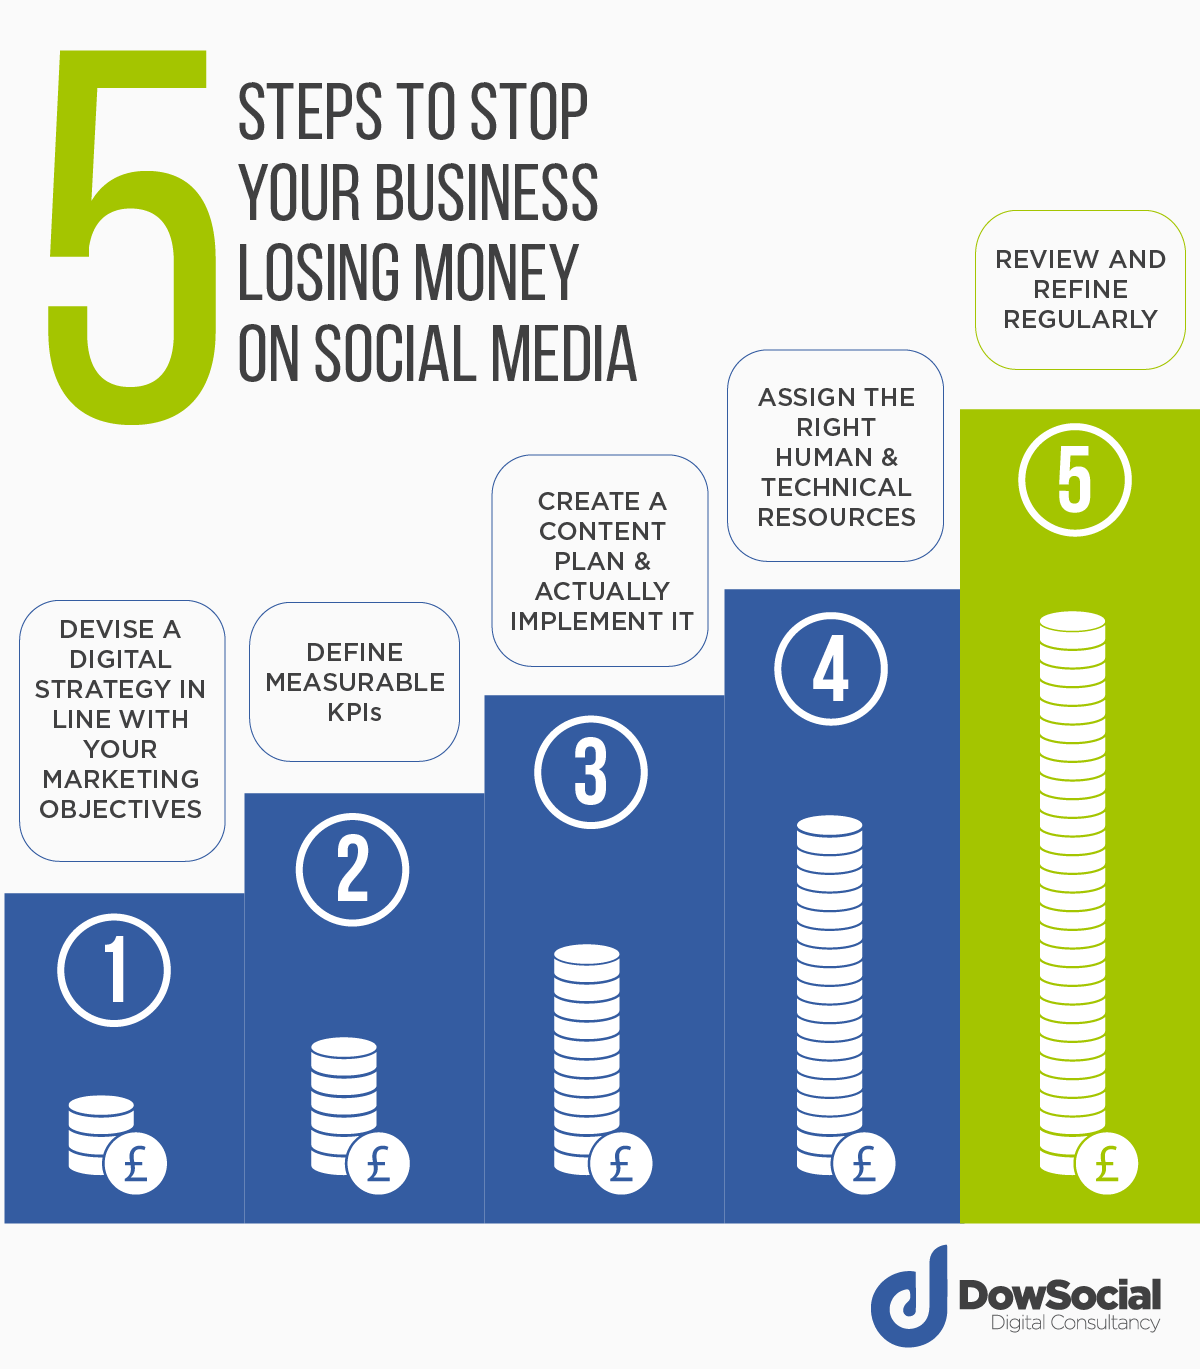
One way that we have used infographics at DowSocial is for the first blog in our 30 Day Blogging Challenge.
The blog was about “5 Steps To Stop Your Business Losing Money On Social Media” and we tasked our graphic designer to come up with a graphic that would summarise the different steps in a simple and easy to understand way.
Below are the two designs we created, they are simple and can be used to promote the blog on social media, the infographic is easy to understand and therefore shareable.
The amount of engagement that these posts get is higher than the tweeted links to the blog on their own or with normal images.

